One group claimed 14 of India’s 20 ransomware victims
30 May 2026 to 30 August 2026 — observed cyber threat activity across 23 Indian industry verticals, counted for the quarter.
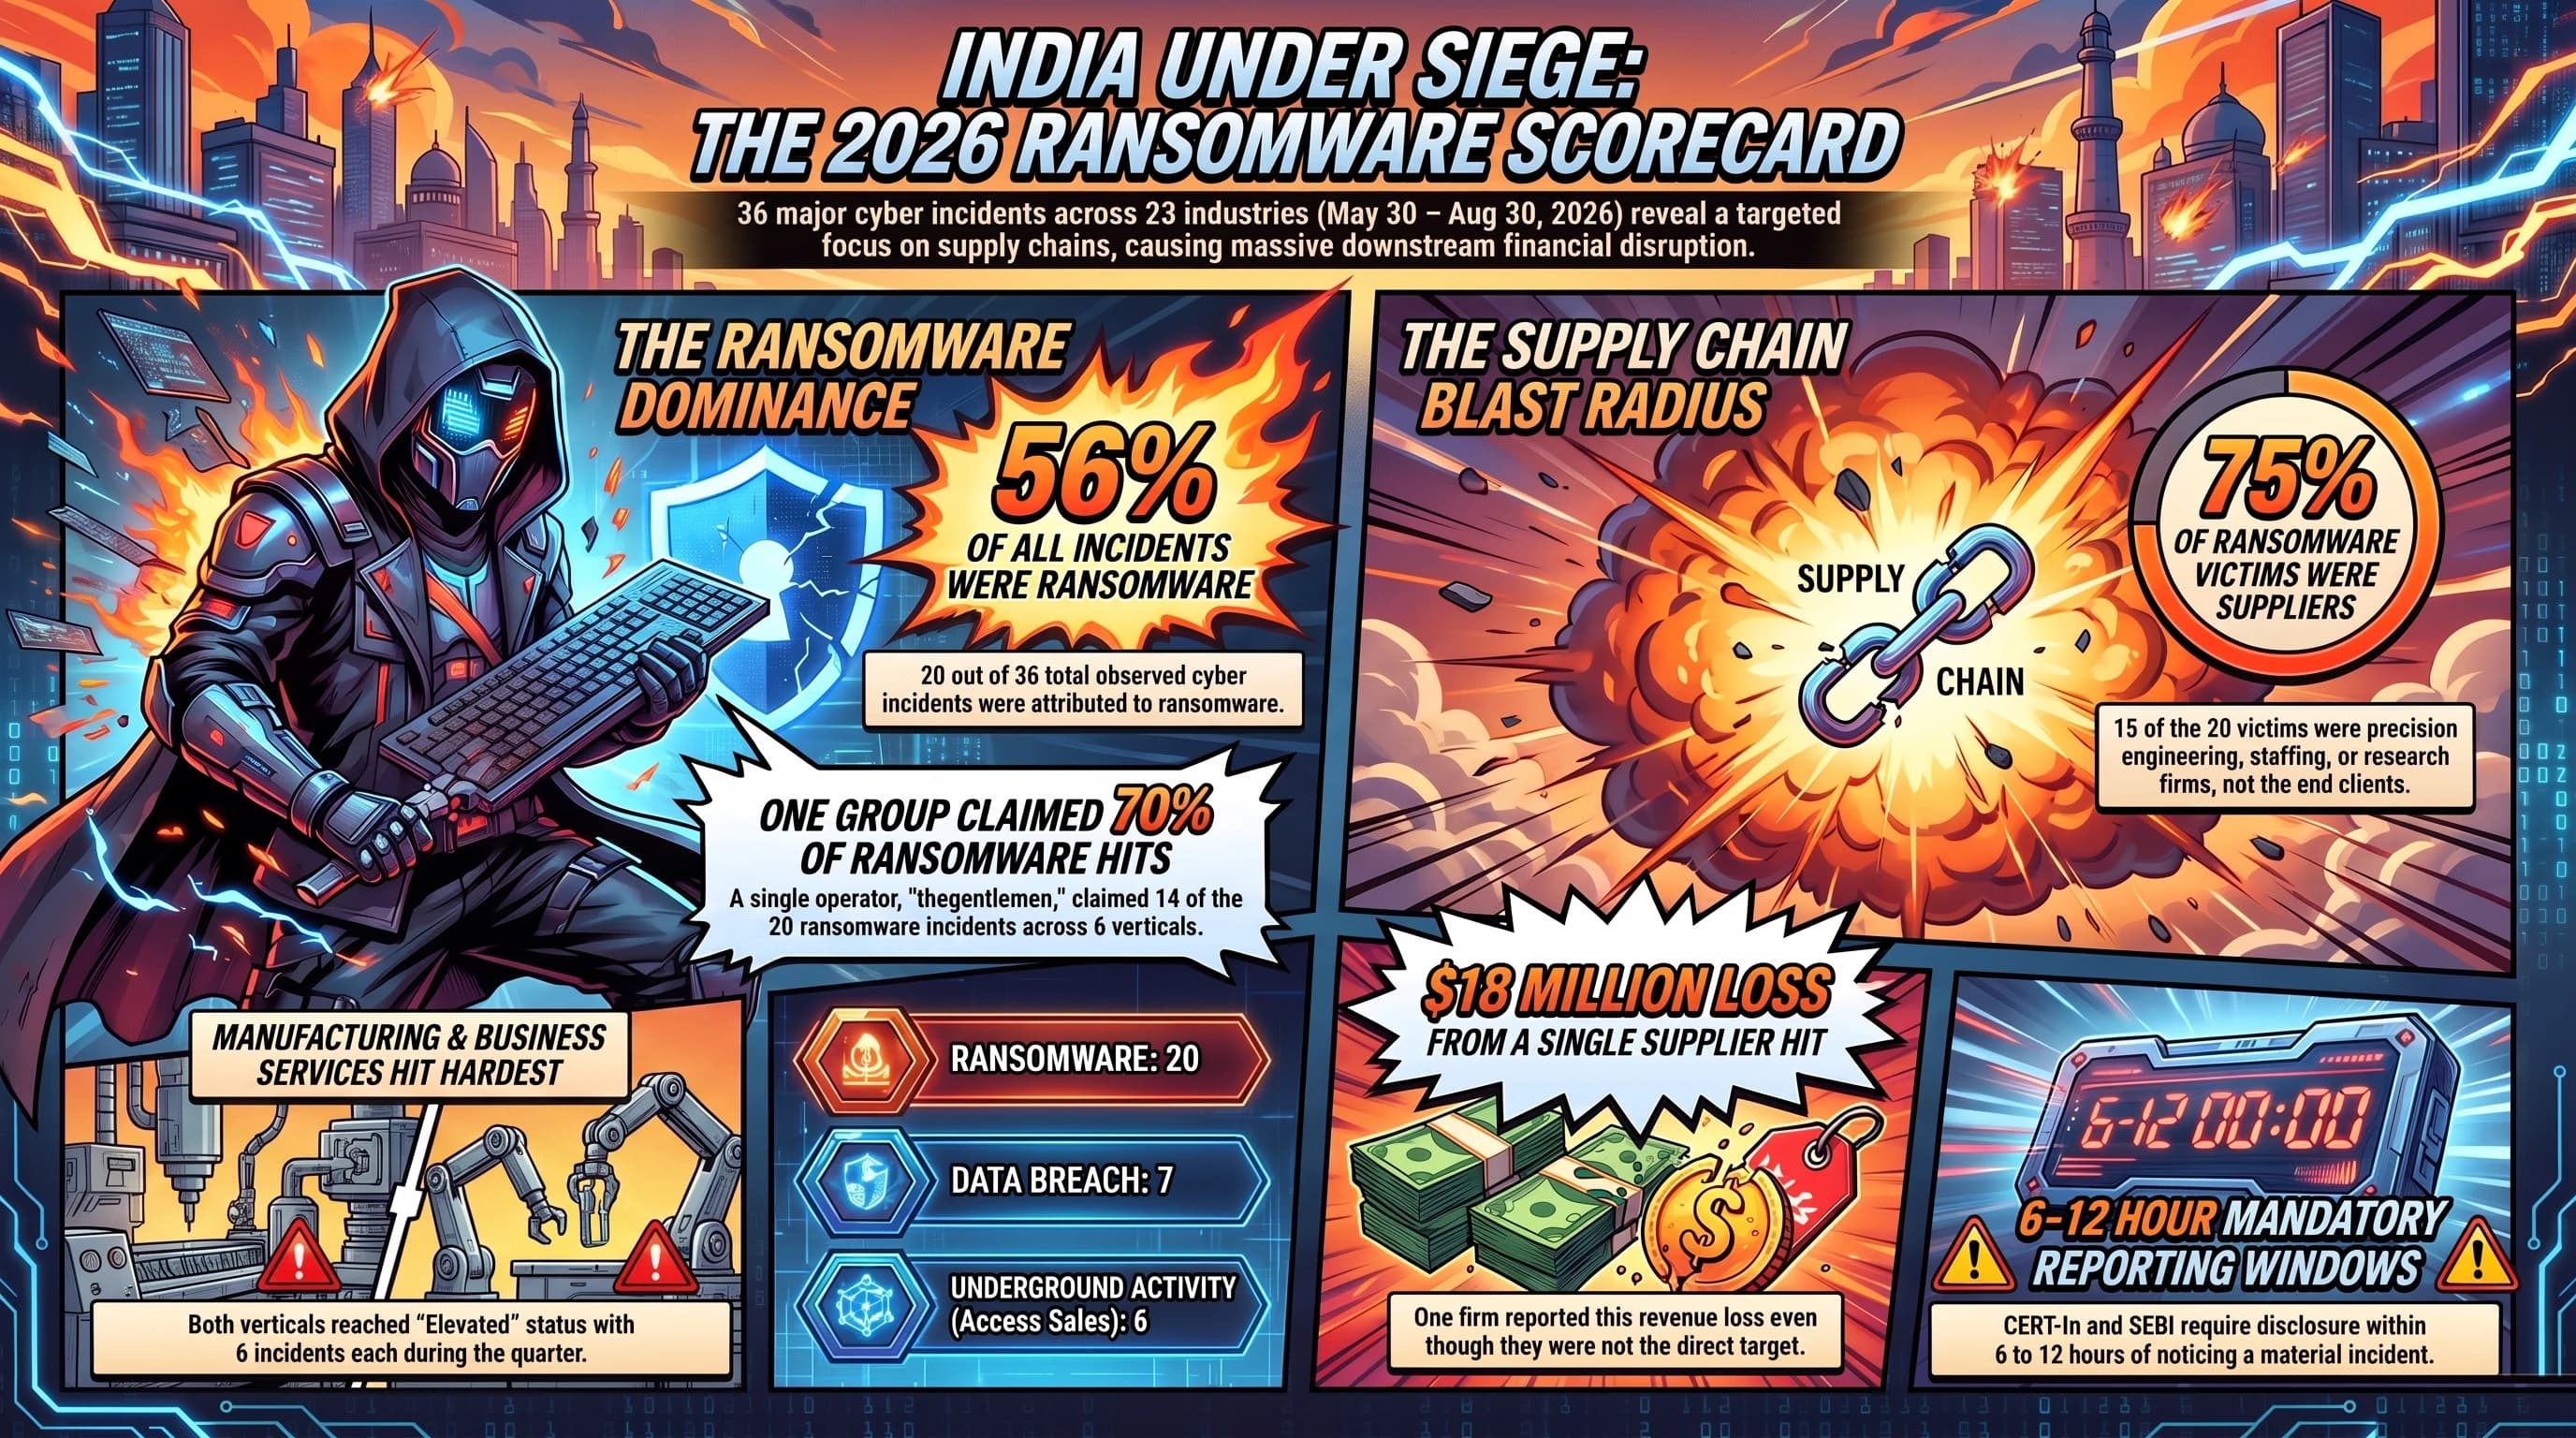
Between 30 May and 30 August 2026, fifteen of those twenty were suppliers — precision engineering, CNC machining, facility management, staffing, market research — not the companies that depend on them.
That is where the money moves. A supplier stops, and the disruption runs both ways through the chain at once: upstream into its own vendors, downstream into its customers. Nobody involved can size the blast radius while it is happening. One incident in this window carried a reported revenue loss of $18 million, and the firm that lost it is not the firm that was attacked.
The scorecard
30 May 2026 to 30 August 2026
thegentlemen claimed 14 of the 20 incidents attributed to a named groupThe most concentrated single claimant in this edition, out of 36 counted in all. Names a threat group, not a victim — no organisation is identified here or in the dataset.
- Ransomware 20
- Data Breach 7
- Underground Activity 6
- APTs 1
- Hacktivism 1
- Malware And Hacking 1
| Vertical | Incidents | Activity | Categories |
|---|---|---|---|
| Aerospace/Defense | 2 | Active | Underground Activity 1APTs 1 |
| Business Services | 6 | Elevated | Ransomware 6 |
| Consumer Goods | 0 | No activity observed | — |
| Credit Union | 1 | Watch | Data Breach 1 |
| Education | 3 | Active | Ransomware 1Data Breach 2 |
| Energy/Resources | 0 | No activity observed | — |
| Engineering | 4 | Active | Ransomware 4 |
| Finance | 4 | Active | Ransomware 1Data Breach 2Malware And Hacking 1 |
| Food Production | 1 | Watch | Ransomware 1 |
| Government/Politics | 2 | Active | Data Breach 1Hacktivism 1 |
| Healthcare/Wellness | 1 | Watch | Underground Activity 1 |
| Insurance | 0 | No activity observed | — |
| Legal | 0 | No activity observed | — |
| Manufacturing | 6 | Elevated | Ransomware 5Underground Activity 1 |
| Media/Entertainment | 1 | Watch | Ransomware 1 |
| Nonprofit/NGO | 0 | No activity observed | — |
| Real Estate | 1 | Watch | Underground Activity 1 |
| Retail | 0 | No activity observed | — |
| Technology | 1 | Watch | Underground Activity 1 |
| Telecommunications | 2 | Active | Ransomware 1Underground Activity 1 |
| Tourism/Hospitality | 1 | Watch | Data Breach 1 |
| Transportation | 0 | No activity observed | — |
| Utilities | 0 | No activity observed | — |
- Aerospace/Defense2ActiveUnderground Activity 1APTs 1
- Business Services6ElevatedRansomware 6
- Consumer Goods0No activity observed
- Credit Union1WatchData Breach 1
- Education3ActiveRansomware 1Data Breach 2
- Energy/Resources0No activity observed
- Engineering4ActiveRansomware 4
- Finance4ActiveRansomware 1Data Breach 2Malware And Hacking 1
- Food Production1WatchRansomware 1
- Government/Politics2ActiveData Breach 1Hacktivism 1
- Healthcare/Wellness1WatchUnderground Activity 1
- Insurance0No activity observed
- Legal0No activity observed
- Manufacturing6ElevatedRansomware 5Underground Activity 1
- Media/Entertainment1WatchRansomware 1
- Nonprofit/NGO0No activity observed
- Real Estate1WatchUnderground Activity 1
- Retail0No activity observed
- Technology1WatchUnderground Activity 1
- Telecommunications2ActiveRansomware 1Underground Activity 1
- Tourism/Hospitality1WatchData Breach 1
- Transportation0No activity observed
- Utilities0No activity observed
How the bands are set. Elevated is 5 or more incidents in the quarter, Active is 2 to 4, Watch is one, and no activity observed is none. Nothing here is judged — the band follows from the count.
This is not a security rating. A band measures observed threat activity in a vertical over the period. It says nothing about the security posture, control maturity or risk of any organisation within that vertical.
8 of the 23 verticals recorded no observed activity in this window. That means none was seen, not that none occurred.
Manufacturing and Business Services sit in Elevated, both on six incidents. Eight of the 23 verticals recorded no observed activity in this pull — which means none was seen, not that none occurred. This edition reflects a refreshed pull for 30 May to 30 August 2026, correcting five verticals where the original 21 May–21 August figures undercounted — Business Services, Engineering, Finance, Government/Politics and Media/Entertainment — and reattributing one 21 July hacktivism incident from Energy/Resources to Government/Politics, per this pull’s naming of the department hit. Aerospace/Defense and Real Estate were outside this pull; their counts carry forward the original 21 May–21 August figures unrefreshed.
What the quarter showed
- Ransomware was 56% of everything observed. Twenty of 36 incidents. Nothing else came close.
- One operator, six verticals. thegentlemen claimed fourteen of the twenty ransomware incidents, spread across Manufacturing, Business Services, Engineering, Education, Media/Entertainment and Telecommunications — not the two-vertical picture the original quarter suggested. NightSpire appears twice; four other groups appear once each.
- Access is sold before it is used. Six listings offered entry or stolen data rather than an attack — VNC access to a senior employee’s machine at an IT services firm, SSH access to a telecoms operator, RDP access to a technology company, 413GB of patient data from a healthcare provider, 2.4 million real-estate customer records, and material from an Indian missile programme. That is next quarter’s incident list, on sale now.
- Finance was hit across three fronts. One ransomware attack — 1.57TB from a diversified financial group — plus two data breaches and a fake banking-app campaign harvesting device notifications and 2FA codes. Insurance recorded nothing; Credit Union recorded one breach.
- Education carried the credential losses, again. A university’s admin credentials and OAuth tokens in one breach, a national accountancy body’s member records in the other — the same pattern as the original quarter.
- Twelve of the twenty fell in July. Read that as leak-site publishing in tranches, not a July surge. A listing date is not an attack date.
Why it reaches your numbers before it reaches the news
None of the twenty is listed. Several sit in the supply chains of companies that are, and a private supplier’s outage never carries the acquirer’s, the analyst’s or the market’s name on it — until the quarter misses.
Concentration is the multiplier. Fourteen organisations, one group, six verticals, one window. A buyer single-sourcing across those verticals is not holding fourteen independent risks.
And the disclosure that follows
| Incident type seen in this quarter | Who it binds | The obligation |
|---|---|---|
| State electricity department defaced by hacktivists | Everyone — s.70B(6), IT Act 2000 | CERT-In, 6 hours from noticing |
| Ransomware at a listed manufacturer | SEBI, LODR disclosure | 12 hours for a material cyber incident |
| Ransomware at a bank’s outsourced provider | RBI — the 2026 Directions for that entity class, plus the 2025 outsourcing Directions | The supplier’s outage is the bank’s incident |
| Member or employee personal data exposed | DPDP Rules 2025 | Breach intimation commences 13 May 2027 |
| Telecom operator encrypted | CERT-In, plus licence conditions | 6 hours |
Five questions for the board
- Which suppliers could stop your revenue? Not the largest by spend — the ones that, dark for a fortnight, delay shipment, production or client delivery. Manufacturing, Business Services and Engineering carried fifteen of the twenty ransomware incidents.
- What is a two-week outage worth in your numbers? One incident here cost a reported $18 million. If you cannot put a figure against your top ten suppliers, that is the gap.
- Would you learn of it in time to say anything? Most listings never reach the news media. A disclosure you first hear about from a customer is already late.
- Is your single-sourcing concentrated in the verticals above? One group, fourteen organisations, six verticals.
- Can you evidence supplier security to an analyst, an insurer or an acquirer? Annual questionnaires are not evidence about a supplier compromised last month.
The numbers behind this edition
36 counted incidents across the quarter of 30 May 2026 to 30 August 2026, by category: Ransomware 20 · Data Breach 7 · Underground Activity 6 · APTs 1 · Hacktivism 1 · Malware And Hacking 1. A further 8 items in the source set were global advisories or industry news with no India nexus, and are excluded from every figure on this page.
| Claiming group | Incidents |
|---|---|
| thegentlemen | 14 |
| NightSpire | 2 |
| Four other named groups, one each | 4 |
Download this edition
Generated from the same source this page renders from, so the files and the grid cannot disagree. Aggregate counts only — there are no incident-level records in either file.
- india-threat-scorecard-2026-08.json — the edition, with per-vertical and per-category counts nested.
- india-threat-scorecard-2026-08.csv — one row per vertical, flattened for a spreadsheet.
- schema.json — JSON Schema for an edition, so you can validate against it rather than guess at the shape.
How this is compiled
Each edition counts publicly observable cyber threat activity affecting organisations in India, arranged across the same 23 industry verticals every time. An item is counted when the affected organisation is in India, or when the activity specifically targets India. Global vulnerability advisories, commodity malware listings and industry news are excluded from the counts.
Nothing is counted twice and nothing is weighted. A vertical’s figure is the number of distinct observations recorded against it in the window, and the band follows from that figure by a published rule. The window, the vertical list and the category list are held constant between editions, because a count series is worth nothing if what is being counted moves.
What we do not publish
No organisation is named, described or made identifiable, in any edition, in the page or in the dataset. We publish counts. This is a deliberate limit rather than an editorial preference: victim identities in threat reporting are frequently drawn from secondary sources and are frequently wrong, and we are not willing to put a name behind a claim we cannot verify.
Disclaimer
The India Cyber Threat Scorecard reports aggregate counts of publicly observable cyber threat activity affecting organisations in India, across 23 industry verticals.
- Informational only. Nothing here is legal, regulatory, financial or security advice. Reporting obligations turn on facts specific to an entity and an incident.
- No organisation is identified. We publish counts, not victims. Nothing here should be read as a statement about any identifiable organisation.
- Sources and method. Compiled and analysed by BitScore from its threat monitoring of Indian organisations, drawing on commercial cyber threat intelligence, dark-web and leak-site observation, and third-party news reporting. Some source material is processed using AI and large language model techniques. It may therefore contain inaccuracies, including in dates and in the attribution of activity.
- Observations, not confirmed breaches. An entry counts an observation — a claim made by a threat group, a marketplace listing, or a public report. It is not confirmation that a compromise occurred, nor of its scope.
- Not a security rating. The bands measure observed threat activity in a vertical over a period. They do not measure the security posture, control maturity or risk of any organisation in that vertical, and they are unrelated to any security rating.
- Coverage is a sample. What is observable is not everything that happened. A vertical showing no activity means none was observed in the period, not that none occurred.
- Corrections. If you believe something here is wrong, write to ni.ia.erocstib@ttimin and we will check it and correct the record.
- No liability. Provided “as is”. BitScore Cybertech LLP accepts no liability for any loss arising from reliance on it.
The published counts are free to reuse under CC BY 4.0 — use them, and credit bitscore.in.
This edition covers 30 May 2026 to 30 August 2026. Counts are of observations recorded in that window; an observation date is the date activity became visible, which is not the date it began.